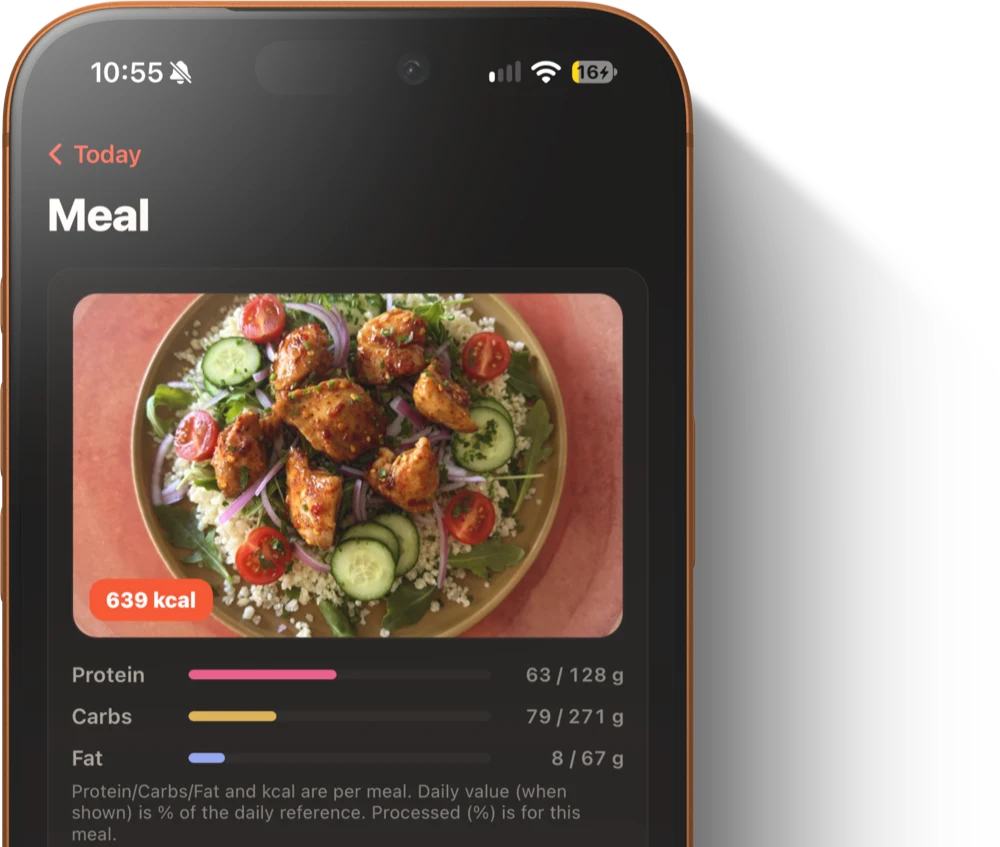
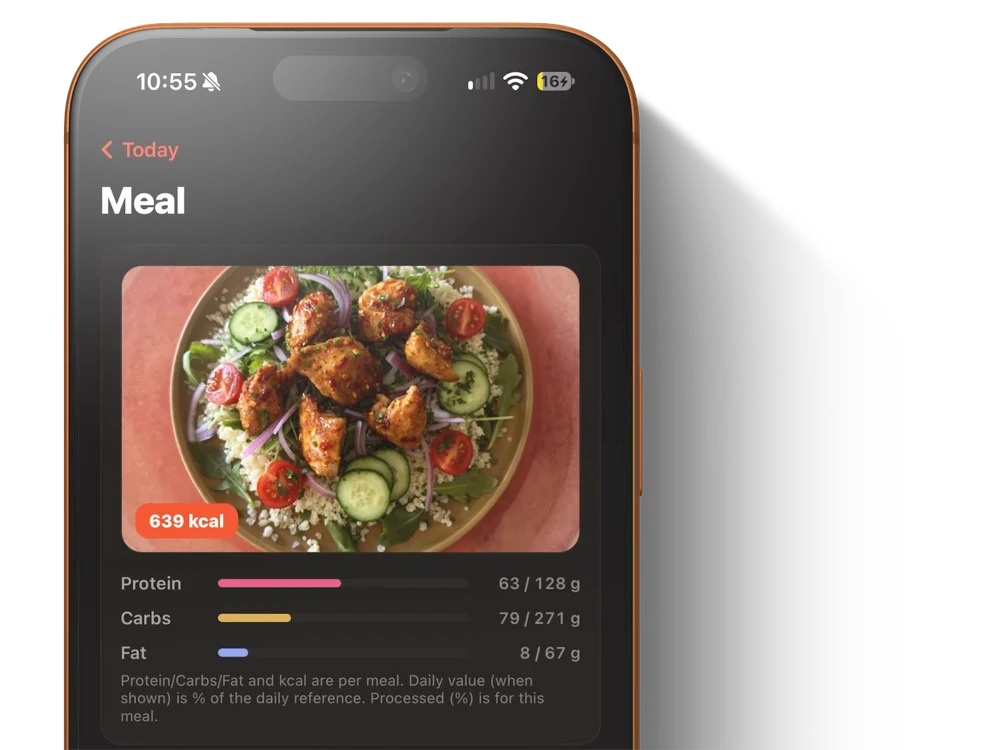
639kcal · P 63 · C 79 · F 8
Protein49% Carbs29% Fat13%
Each macro against your daily target, not a generic reference. One plate carried half the day's protein and an eighth of its fat.
A photo of the plate, a barcode, or a voice note. That is all it takes to read a meal in full.
Download the appOne reviewed chicken salad shown three ways: calories and macros against goals, a categorical FODMAP flag, and GI and GL where underlying data is available.
Understand your mealsEach macro against your daily target, not a generic reference. One plate carried half the day's protein and an eighth of its fat.
Ingredients
The app rates a meal low, moderate or high in FODMAPs and points to the ingredients behind it.
GI describes carbohydrate quality; GL also uses the available-carbohydrate amount, so it changes when you correct the portion. Both appear only when the underlying data exists.
Three views of one reviewed meal. Example data; availability depends on data coverage.
Logging without the ritual
Camera, gallery, nutrition label, barcode, text, voice, a favorite or Quick Log let you start a meal in the way that fits the moment. Review ingredients and portions, then keep the detail available for that entry.
The app itself
Real screens from a real logged meal, not a concept.
A photograph, the calories, and the three macros against the day you are having. 639 kcal, and 63 g of protein out of 128.
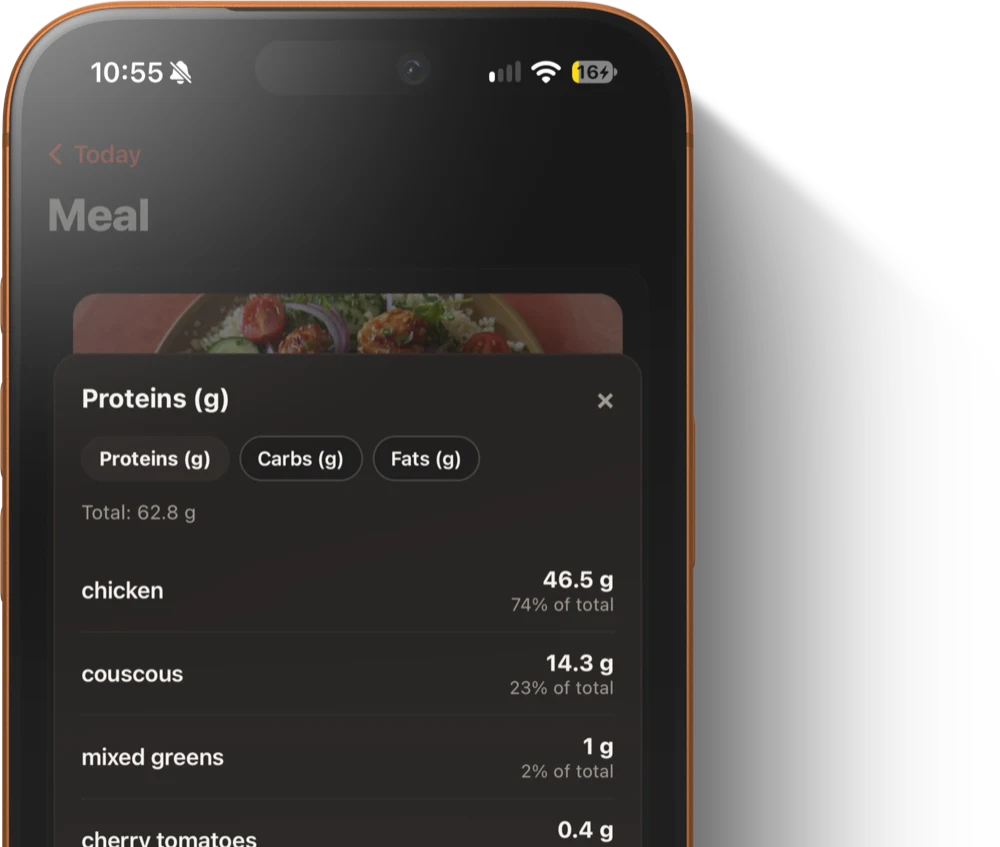
Protein attributed to every detected ingredient, in grams and as a share. The chicken carried 46.5 g of the 62.8. Very nearly three quarters of it.
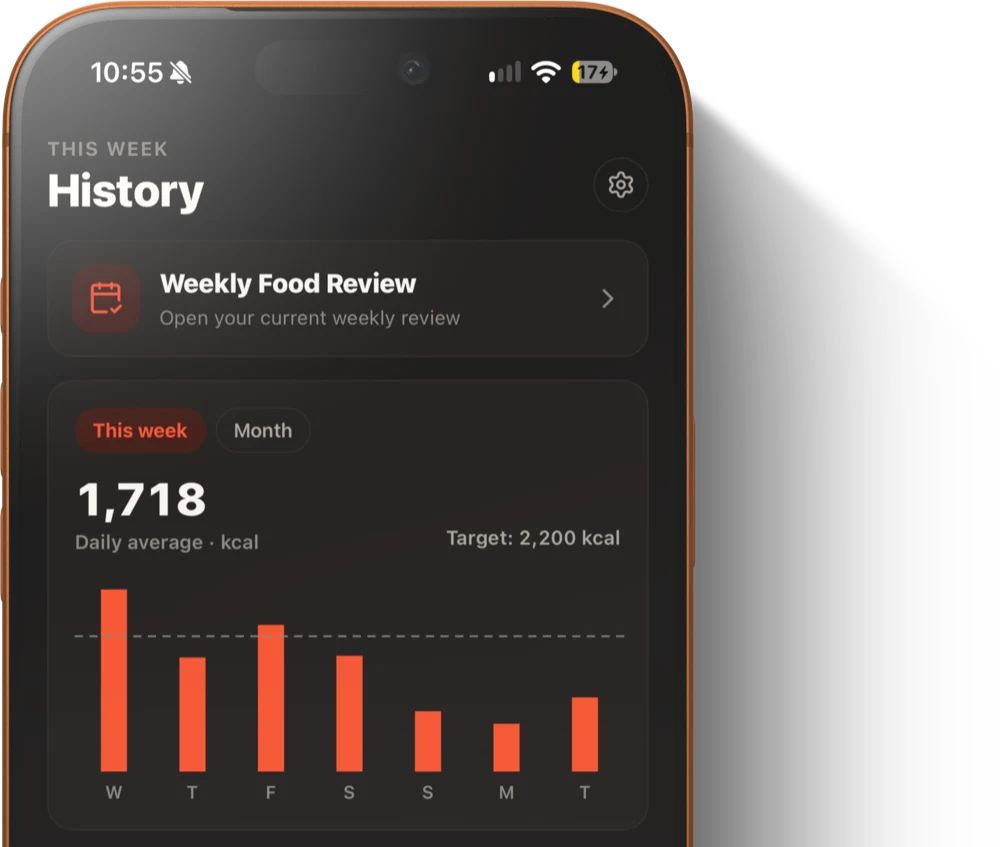
1,718 kcal a day against a 2,200 target, with the macro averages underneath. Fat is over; protein is not.
Protein by ingredient
A total is a number you cannot act on. The share is. In this parfait the yogurt carried two thirds of the protein and the granola a fifth, while the berries everyone adds for the photograph contributed two per cent between them.
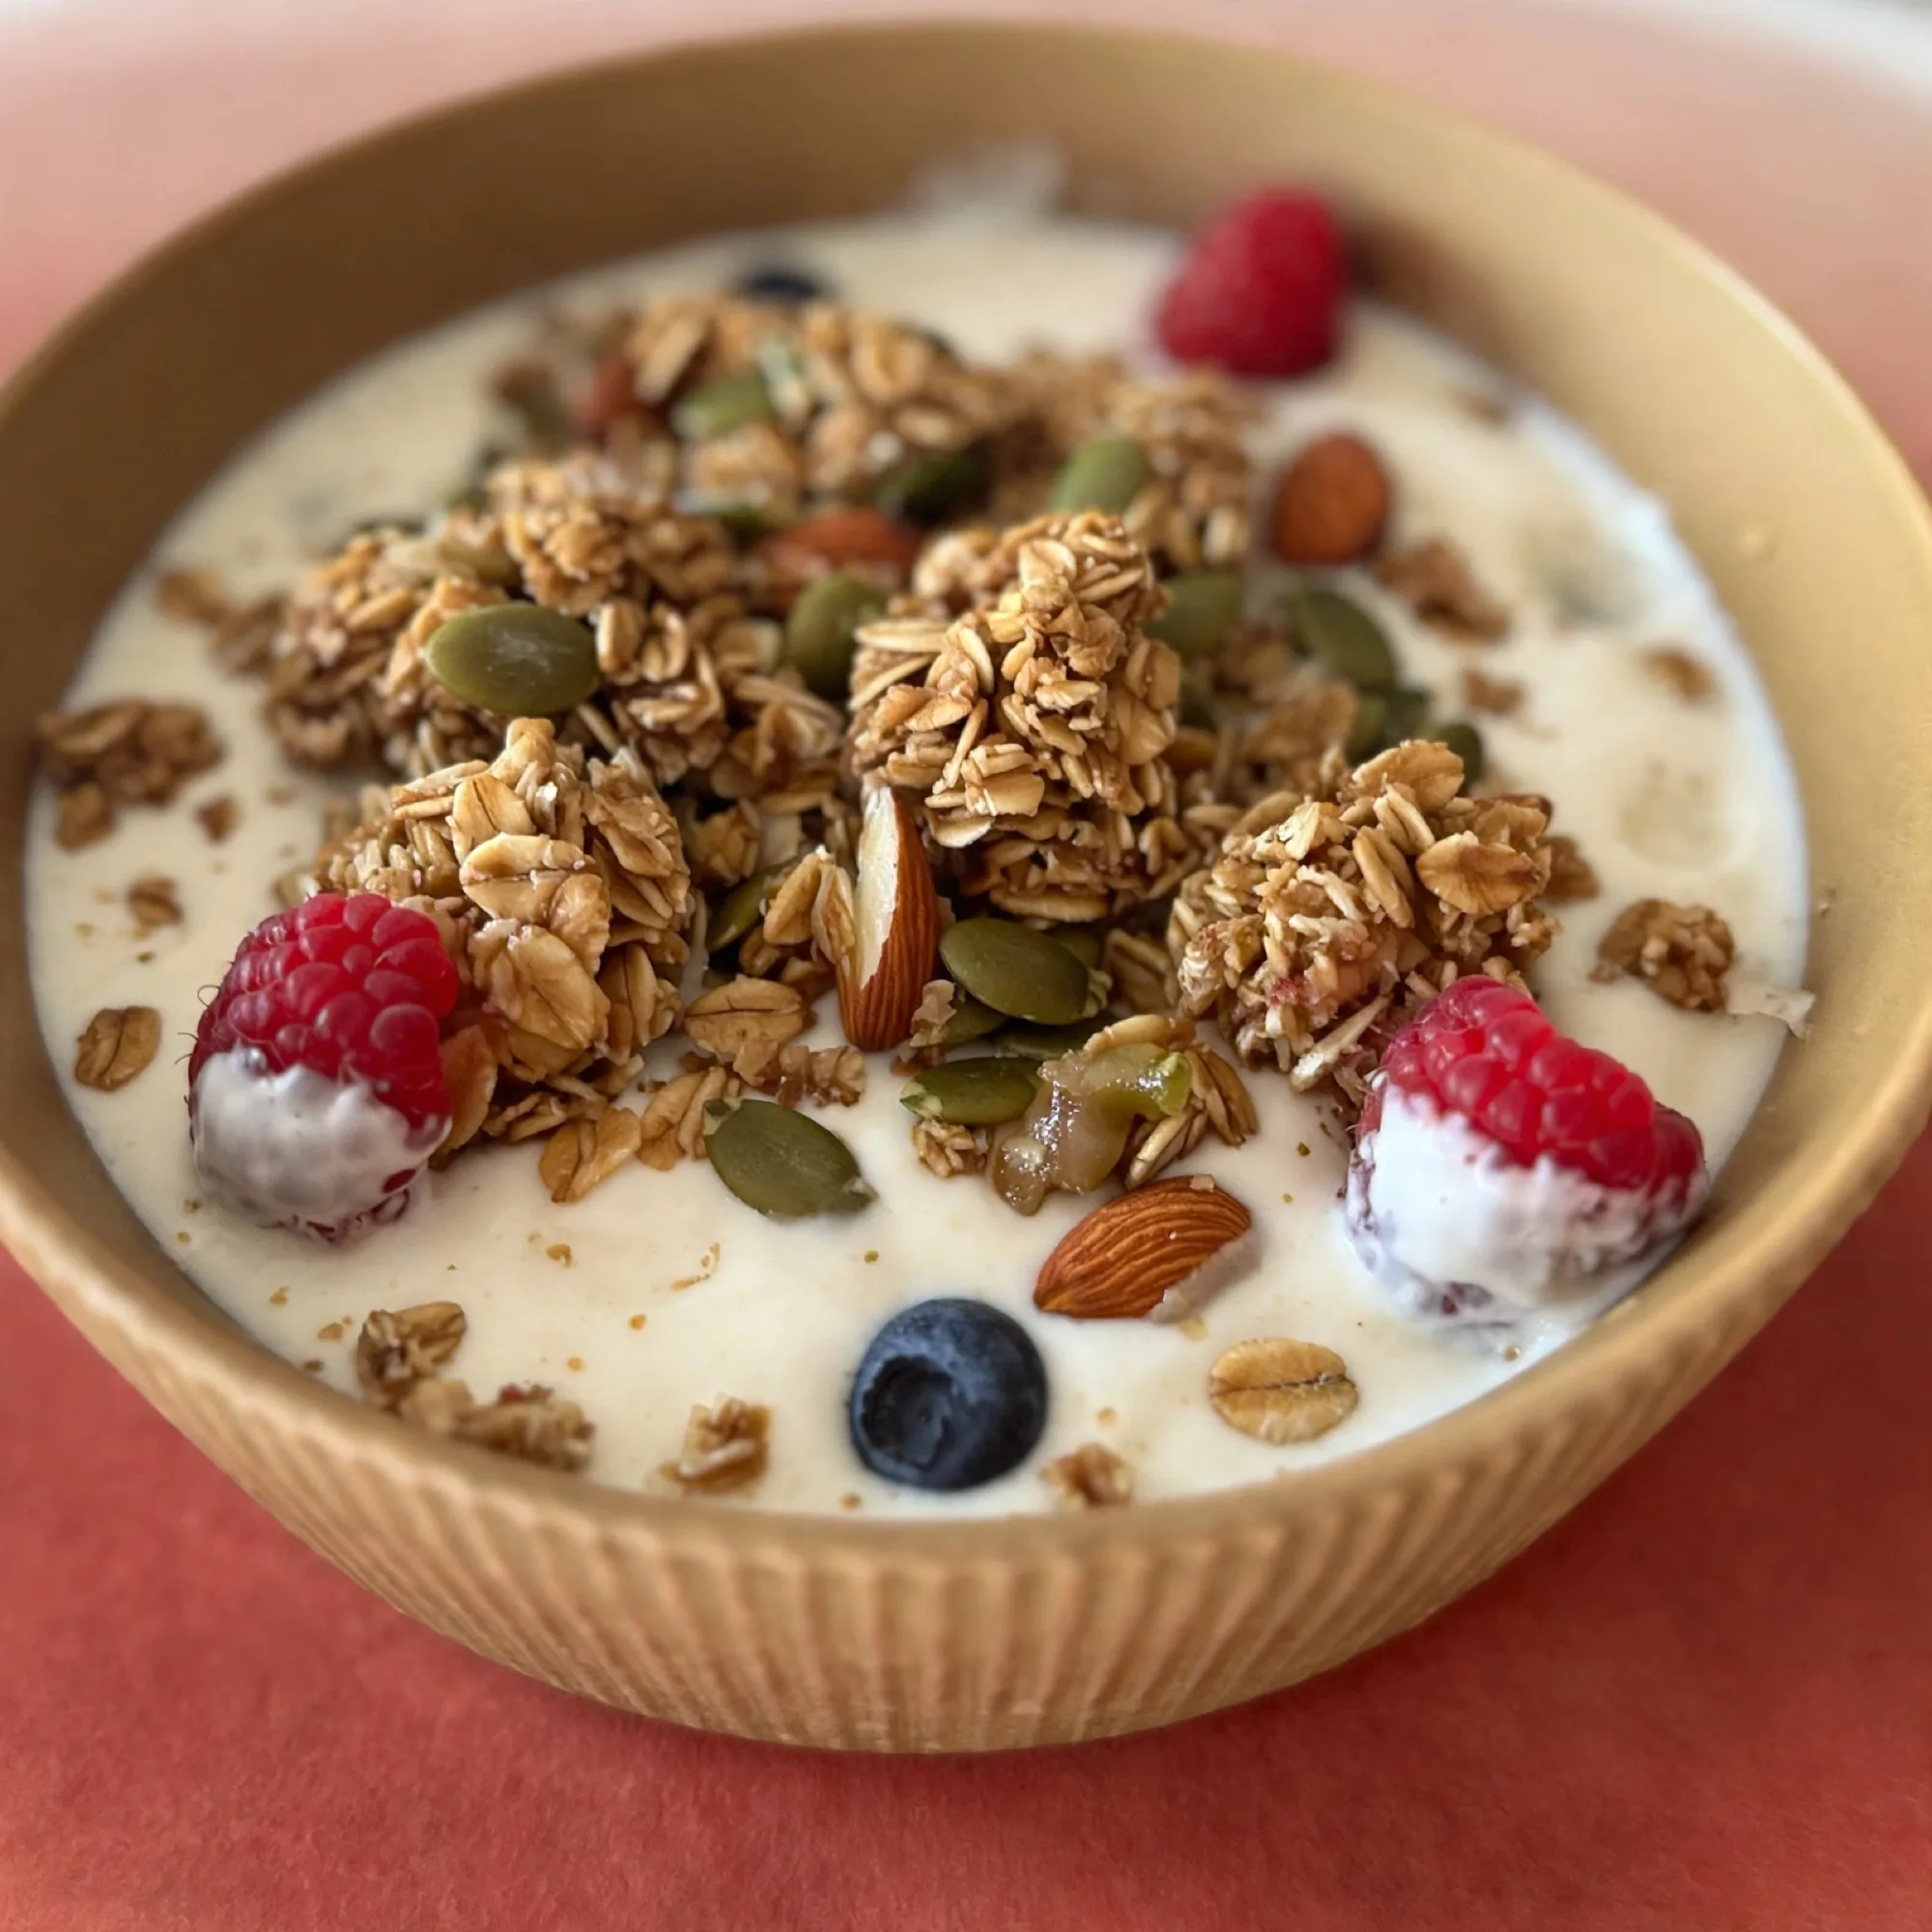
| Detected ingredient | Protein | Share of total |
|---|---|---|
| Yogurt | 15 g | 65% |
| Granola | 4.5 g | 19% |
| Almonds | 2.1 g | 9% |
| Pumpkin seeds | 1 g | 4% |
| Raspberries | 0.2 g | 1% |
| Banana | 0.2 g | 1% |
| Blueberry | 0.1 g | 0% |
| Total | 23.1 g | 100% |
A real logged meal, not a model: the app detects the ingredients, attributes the protein to each one, and reports both grams and share. Edit an ingredient amount to update its contribution. Other portion-dependent values update too, including the glycemic load does.
Portion, not the food's name
Glycemic index is measured on a fixed 50 g carbohydrate test dose. That is what makes foods comparable, and what makes it a poor description of dinner. Drag the slider: the index holds still while everything you actually ate moves with it.
Boiled white rice. Composition from USDA FoodData Central, index from the international GI tables, load computed as index × available carbohydrate ÷ 100.
Every value here is published or arithmetic on a published value, never an estimate. Try it on another food.
From meal to pattern
Correct a meal once and keep using that detail across goals, trends, deeper food insights and Food Reviews you can open as a PDF.
Use cases
One editable food diary, four focused paths. Turn the same meal history into clearer FODMAP context, weight-plan feedback, protein guidance or GI and GL insight.
See FODMAP levels and the ingredients behind them, where data is available.
The portion matters, too. Food estimates, not a prediction of your glucose response.
Go beyond macros: vitamins, minerals, fibre, sugar, sodium and saturated fat.
FULL ACCESS FIRST. YOUR CHOICE AFTERWARD.
Every Food Premium feature is included for your first 10 days. No separate FODMAP or GI add-ons.
$0
Every Premium feature. Nothing to cancel.
$0
Daily food tracking, calories and macros. No subscription.
$28.99 / year
Billed once per year
Or $8.99 monthly
United States · The same launch price on the App Store and Google Play.
| Feature | First 10 days | Free | Food Premium |
|---|---|---|---|
| FODMAP insights | Included | Not included | Included |
| GI & glycemic load | Included | Not included | Included |
| Nutrient detailsVitamins, minerals, fibre, sugar, sodium & saturated fat | Included | Not included | Included |
| Diet-quality trends | As data builds | Not included | As data builds |
| Food Reviews & PDF | First Monday with enough data | No new reviews | Weekly & monthly |
| Calories, macros & goals | Included | Included | Included |
| Meal editing & barcode scanning (EAN) | Included | Included | Included |
| Meal history | All available history | Last 30 days | All saved history |
| AI image analysis | Unlimited | 30 / month | Unlimited |
Details depend on available data. Reviews and trends need enough logged days. New reviews require active welcome access or Premium. Previously earned reviews and their PDF exports stay available. Your store confirms the local price before purchase.
Keep your launch price while your subscription stays continuously active.
No. There are no payment details and nothing to cancel. Your account continues on Free. A subscription is a separate choice.
Calories, macros, goals, meal editing and barcode scanning (EAN), the last 30 days of history and 30 photo analyses per month. Previously earned reviews and their PDF exports remain available.
On a Monday once you’ve logged enough meals across several days, while your welcome access or Premium is active. Ten days of access does not guarantee a monthly review.
No. Food works on its own. If an eligible paid 3Sense plan already includes Food Premium, you do not need to buy it again.
No payment details. No automatic charge. Free afterward unless you subscribe.
No payment details. No automatic charge. Free afterward unless you subscribe.
3sense Food
Scan the code, then log with camera, gallery, label, barcode, text, voice, a favorite, or Quick Log.
Try all of Premium. Free for 10 days. No payment details. No automatic charge. Free afterward unless you subscribe. Compare plans
food.3sense.ai/app